APU Spectrum Analyzer
Key Features
- Configurable FFT analysis with Rect, Hann, Hamming, Blackman, and Kaiser windows.
- FFT sizes from 64 to 65536 samples for fast checks or high-resolution inspection.
- Log, linear, and note-based frequency scales for different mixing and mastering views.
- Histogram hold for measuring longer passages instead of only the current moment.
- Snapshot capture for comparing mixes, references, or different processing moves.
- Standalone application plus VST, AU, and AAX plugin support for DAW and non-DAW analysis.
Description
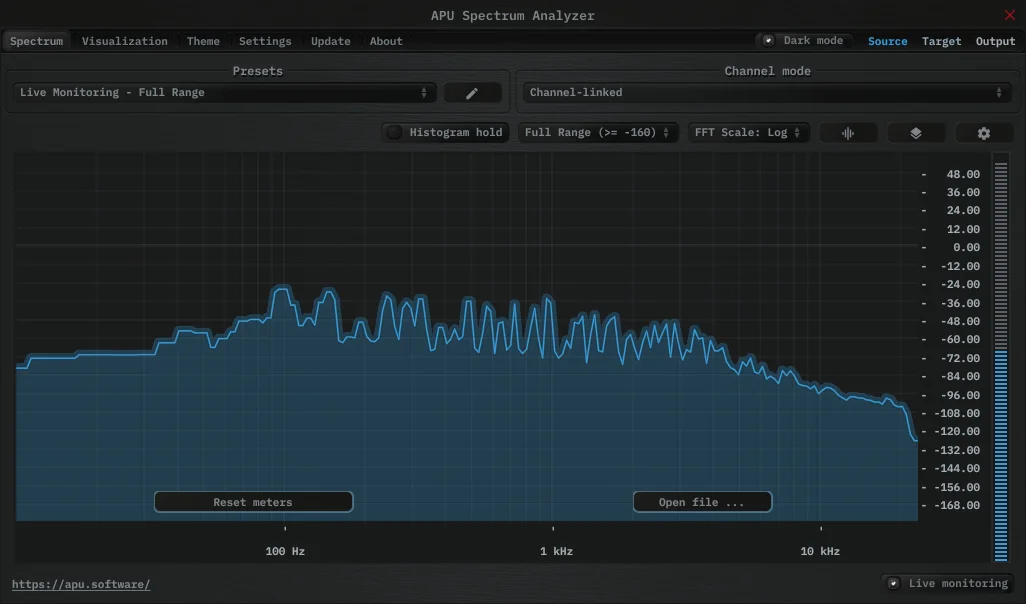
APU Spectrum Analyzer is a spectrum analysis plugin and standalone app for checking frequency content in real time. It gives mix engineers detailed FFT control, multiple display scales, snapshot capture, and long-term histogram hold without turning the analyzer into a heavy metering suite.
The core view is built around adjustable FFT windows, with Rect, Hann, Hamming, Blackman, and Kaiser options plus sizes from 64 to 65536 samples. That makes it useful for quick balance checks, detailed low-end inspection, and slower averaged reads across full sections of a track.
Its workflow strength is visual flexibility. You can switch between log, linear, and note-based frequency scales, use standard dB ranges or auto range, adjust bucket size separately from FFT size, and change the raster orientation to match the way you like to read the spectrum.
For producers who usually reach for a basic analyzer, the snapshot and histogram tools are the upgrade. They make it easier to compare mix revisions, spot tonal buildup over time, and keep a consistent reference view while moving between recording, mixing, and mastering tasks.
Frequently Asked Questions
Can APU Spectrum Analyzer analyze audio outside a DAW?
Yes. The official product page lists it as both a standalone application and a plugin, and it can load an external file for full spectrum analysis.
What makes the analyzer more flexible than a basic spectrum display?
It exposes the FFT window type, FFT size, scale, dB range, bucket size, and raster orientation. That gives you more control over whether the display favors quick movement, higher detail, or a longer-term tonal read.
Can it help compare mix revisions or references?
Yes. The snapshot feature lets you capture a spectrum view for reference, while histogram hold accumulates spectrum data over time for checking broader sections of a track.