gFractor
Key Features
- Three analysis modes cover Mid/Side, Left/Right, and Transient/Tone views for fast comparison of stereo and content-based signal behavior.
- Component monitoring lets you isolate mid, side, left, right, transient, or tonal material while keeping the same analyzer workflow.
- Sidechain comparison can show a reference signal beside the live input, overlay it as a ghost curve, or swap views from the keyboard.
- Peak Hold curves can be captured, saved, and loaded later as target references for tonal-balance matching across sessions.
- Built-in oscilloscope mode displays waveform timing with optional spectral coloring for seeing frequency content over time.
- Stereo tools include a goniometer, correlation meter, and per-octave width view for diagnosing phase and mono-compatibility issues.
- Right-click band-pass soloing helps narrow in on specific frequency regions without inserting a separate EQ or filter.
Description
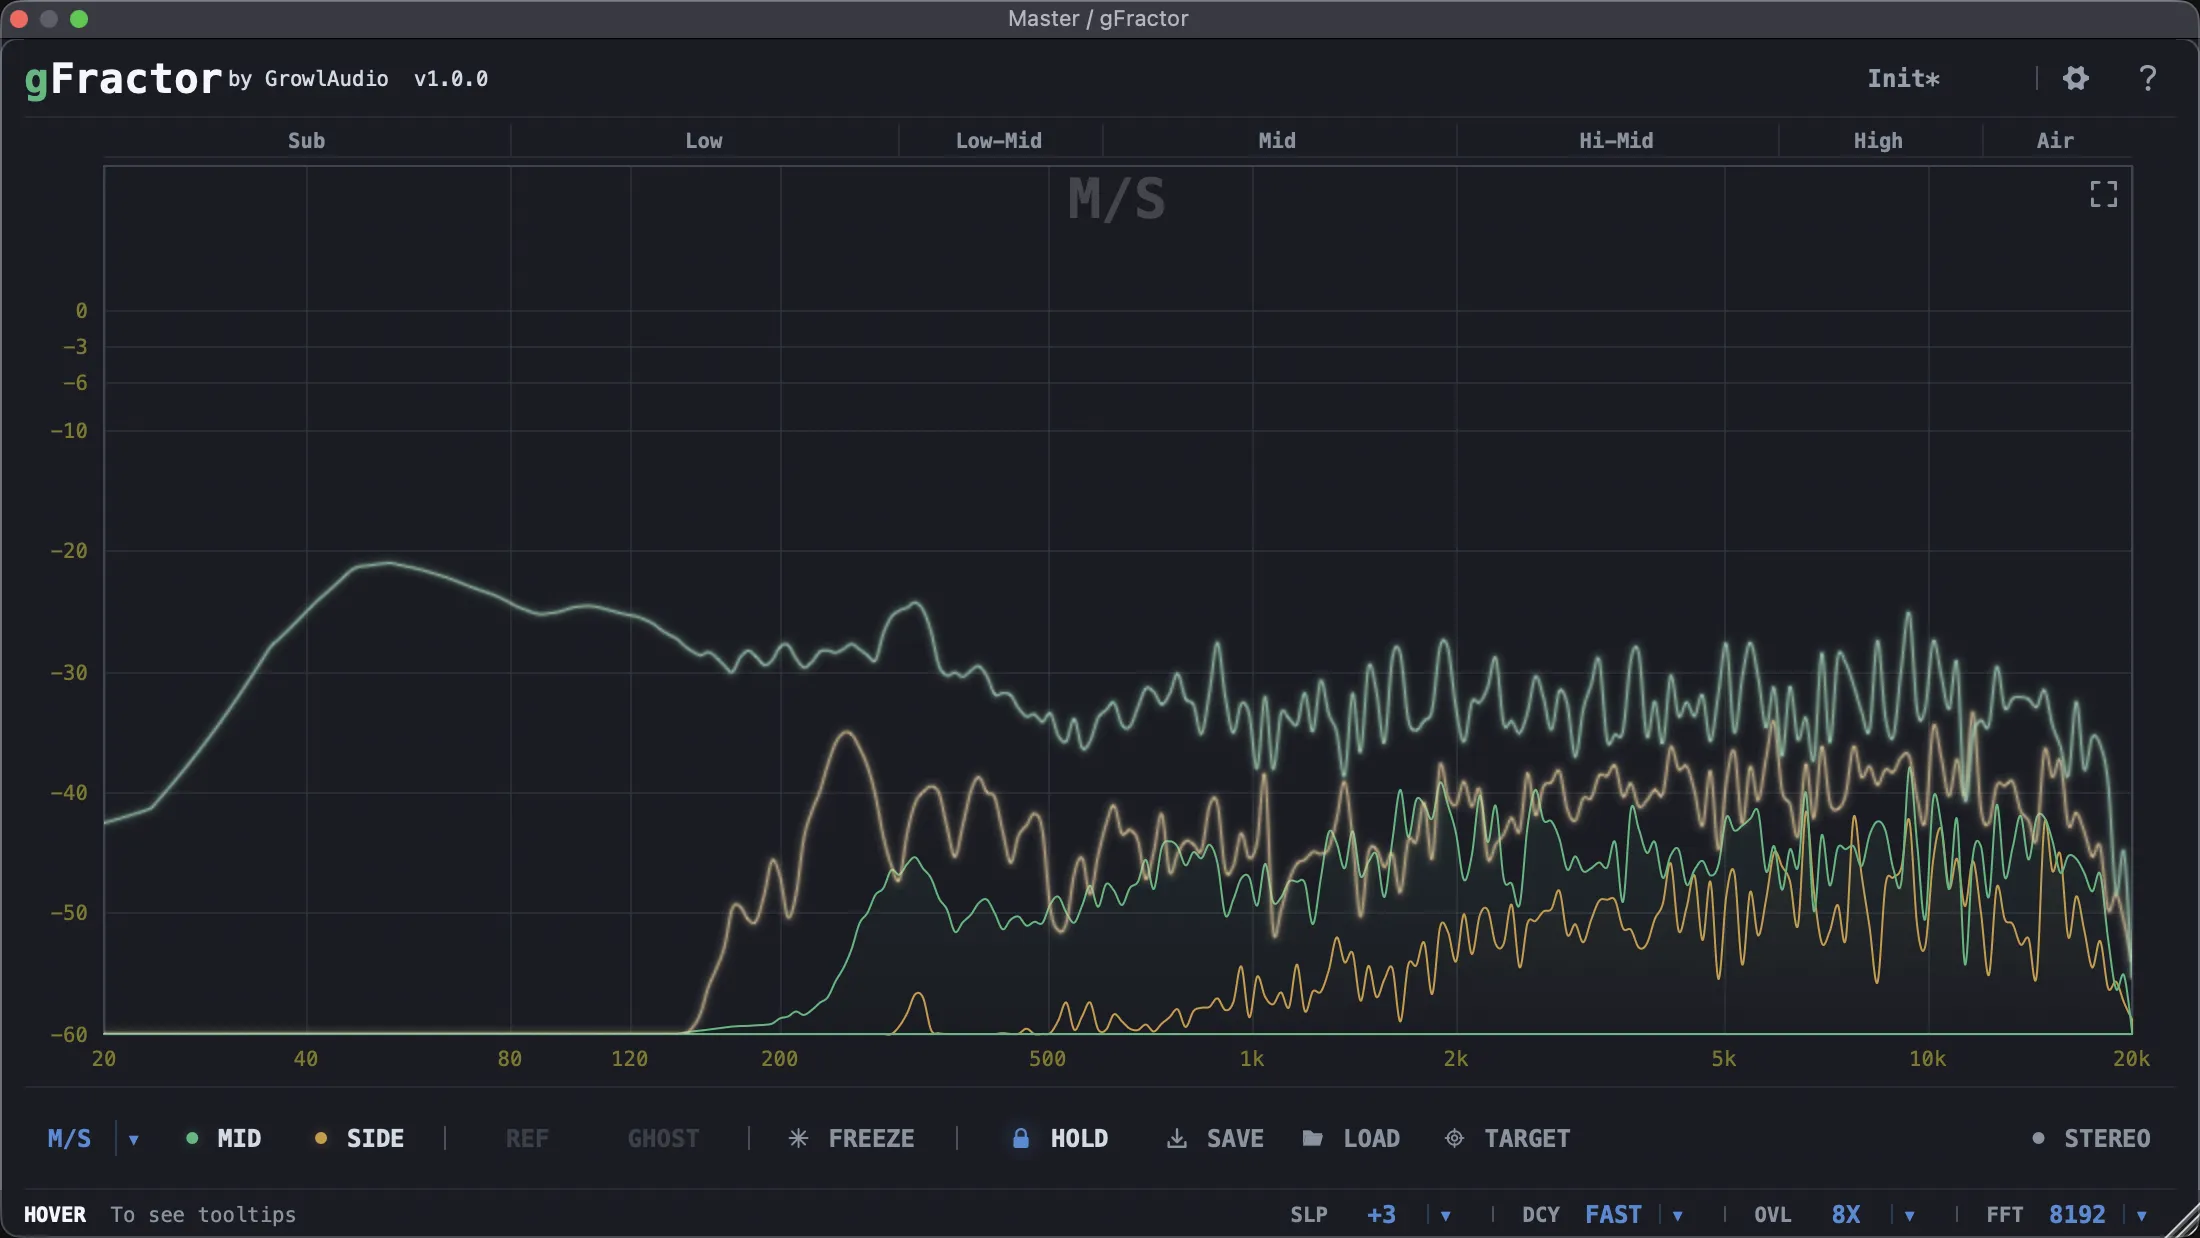
gFractor is a cross-platform spectrum analyzer and oscilloscope plugin from Growl Audio for checking frequency balance, stereo width, phase, and transient behavior inside a DAW. It combines Mid/Side, Left/Right, and Transient/Tone views so you can inspect a mix from several useful angles without opening separate metering tools.
The main spectrum display supports component monitoring, freeze, peak hold, target curve save and load, and right-click band-pass soloing for quickly isolating a problem range. Sidechain comparison lets you place a reference signal beside or behind the live signal, which makes it useful for matching tonal balance between tracks, buses, and masters.
Beyond the spectrum view, gFractor includes a tempo-synced oscilloscope, a goniometer, a correlation meter, and stereo width per octave. That makes it especially practical for producers who need visual feedback on low-end focus, mono compatibility, and wide material without switching between several utilities.
The official download is direct and account-free, with separate installers for macOS, Windows, and Linux. The developer page states that the plugin has no demo mode, no watermark, and no 30-day trial.
Video Preview

Frequently Asked Questions
What makes gFractor different from a basic spectrum analyzer?
gFractor goes beyond a single left/right FFT display by adding Mid/Side, Left/Right, and Transient/Tone analysis modes. It also includes sidechain comparison, target-curve save/load, an oscilloscope, stereo metering, and band-pass soloing in the same interface.
How does the Transient/Tone mode help in practice?
Transient/Tone mode separates percussive attack information from sustained harmonic content and draws them as separate curves. That can make it easier to see whether a problem is coming from a sharp transient, a ringing tone, or the body of a sound.
Can gFractor compare a mix against a reference track?
Yes. The official page describes sidechain comparison for viewing a main signal against a reference, and it also supports saving a Peak Hold curve as a target file that can be loaded later in another session.
Does gFractor include stereo analysis tools?
Yes. It includes a goniometer, a correlation meter, and a per-octave stereo width display, so it can show both broad stereo-field behavior and which frequency bands are contributing to width.


